Introduction
In today’s fast-paced business environment, companies are constantly looking for ways to improve their project management processes. One such methodology that has gained immense popularity is Agile. Agile methodology allows teams to work collaboratively, adapt to change quickly, and deliver high-quality results. However, managing and tracking Agile projects can be challenging without proper reporting tools. This is where an Agile Reporting Dashboard comes into play. This article will explore the benefits of using an Agile Reporting Dashboard, its key features, best practices, and provide examples of popular tools and software to create one.
What is Agile methodology?
Agile methodology is an iterative and incremental approach to project management that focuses on delivering value to customers through continuous collaboration and feedback. Unlike traditional waterfall methods, Agile allows for flexibility and adaptability, enabling teams to respond quickly to changes in requirements and priorities. Agile emphasizes teamwork, transparency, and continuous improvement, making it highly effective in today’s dynamic business landscape.
How to do agile reporting?
Agile reporting is the process of tracking and communicating the progress of Agile projects. It involves gathering relevant data, analyzing it, and presenting it in a concise and meaningful manner. Agile reporting helps stakeholders, such as project managers, team members, and clients, to have a clear understanding of the project’s status, identify potential risks, and make informed decisions. To do agile reporting effectively, teams need to define key performance indicators (KPIs), establish a regular reporting cadence, and use appropriate tools and techniques.
What is an agile dashboard?
An Agile Dashboard is a visual representation of project data that provides real-time insights into the progress and health of Agile projects. It serves as a central hub for teams to track and monitor key metrics, such as sprint velocity, burn-down charts, and task status. Agile dashboards are super customizable, letting teams pick the exact metrics and visuals that matter most to their projects. They give a full picture of how the project is doing, making decision-making easier and empowering teams to take proactive steps to tackle issues and bottlenecks.
Benefits of using an agile reporting dashboard
An Agile Reporting Dashboard offers several benefits for teams and organizations practicing Agile methodology:
Improved visibility and transparency
One of the primary benefits of an Agile Reporting Dashboard is improved visibility into the project’s progress. It provides a consolidated view of all relevant project data, enabling stakeholders to understand the current status, identify bottlenecks, and track the completion of tasks. This transparency fosters trust and collaboration among team members and promotes a culture of accountability and ownership.
Enhanced decision-making
By having real-time access to project metrics and data, decision-makers can make informed decisions quickly. Agile dashboards allow them to identify potential risks, track the impact of changes, and allocate resources effectively. With accurate and up-to-date information readily available, teams can respond to issues promptly and make necessary adjustments to ensure project success.
Increased productivity and efficiency
Agile Reporting Dashboards provide teams with actionable insights to optimize their workflows and processes. By visualizing metrics such as sprint velocity and task completion rates, teams can identify areas of improvement and implement necessary changes. This continuous feedback loop helps in streamlining operations, eliminating bottlenecks, and improving overall productivity and efficiency.
Key features of an agile reporting dashboard
An effective Agile Reporting Dashboard should possess the following key features:
- Customizable visualizations Agile dashboards should allow teams to customize visualizations based on their specific needs and preferences. This flexibility enables teams to focus on the most relevant metrics and present them in a visually appealing and easily understandable format.
- Real-time data updates To provide accurate insights, Agile Reporting Dashboards should update data in real-time. This ensures that stakeholders have access to the most up-to-date information, allowing them to make informed decisions and take prompt actions.
- Drill-down capabilities A good Agile Reporting Dashboard should provide drill-down capabilities, allowing users to dive deeper into specific metrics or areas of interest. This feature enables teams to investigate issues, identify root causes, and implement targeted solutions.
Best practices for using an agile reporting dashboard
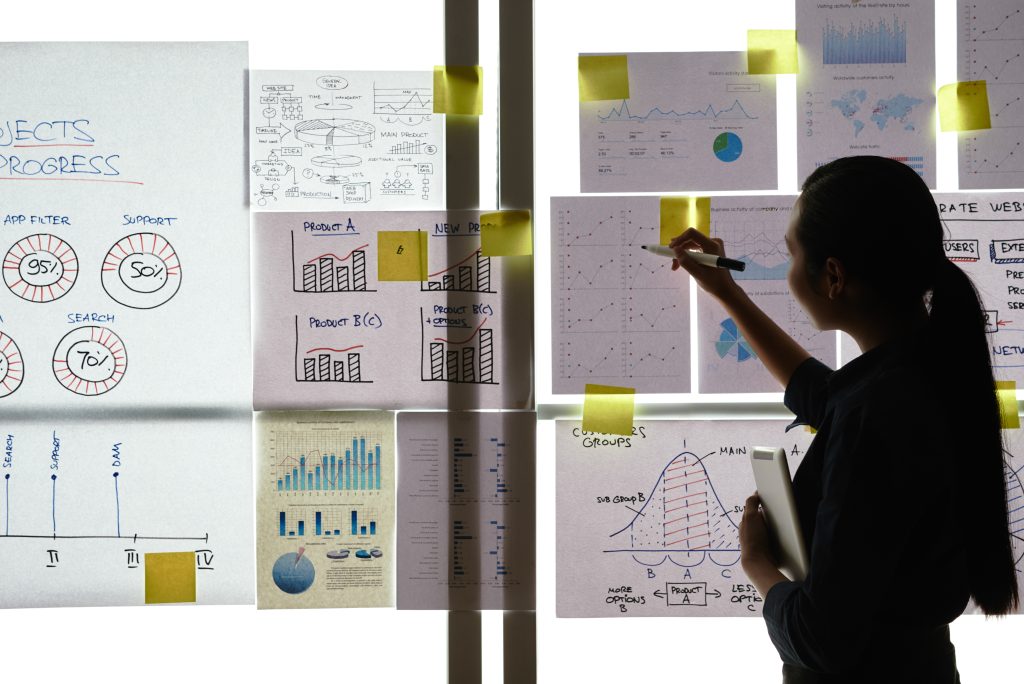
To optimize the effectiveness of your Agile Reporting Dashboard, it is essential to adhere to certain best practices. First and foremost, simplicity and focus should be prioritized. Avoid overloading the dashboard with unnecessary information and concentrate on metrics that hold the utmost relevance to your project and stakeholders. Ensure that visualizations remain clear and concise, facilitating easy comprehension at a glance.
Additionally, regular review and updating of metrics are crucial aspects of dashboard management. As your project advances, the significance of certain metrics may evolve. Therefore, periodic assessments and adjustments are necessary to ensure alignment with the current priorities and goals of the project. This flexibility enables the dashboard to adapt to the evolving nature of the project.
Moreover, an Agile Reporting Dashboard should not function solely as a one-way communication tool. Actively foster collaboration and feedback within your team and among stakeholders. Cultivate a culture that encourages team members and stakeholders to contribute feedback and suggestions for improvement. Utilize the insights gained from the dashboard to drive positive changes, thereby promoting a continuous improvement mindset.
Best Jira dashboard for Scrum team
Jira is a popular project management tool widely used by Scrum teams. It offers a range of features and functionalities to support Agile practices. When it comes to Jira dashboards for Scrum teams, the “Scrum Board” and “Sprint Health Gadget” are highly recommended.
The Scrum Board provides an overview of the project’s backlog items, sprint progress, and team capacity. It allows team members to track their tasks, update their status, and visualize the overall progress of the sprint. The Sprint Health Gadget, on the other hand, provides real-time metrics such as burndown charts and sprint velocity. This gadget helps Scrum teams monitor their progress and make data-driven decisions to optimize their sprints.
How to set up an agile reporting dashboard
Setting up an Agile Reporting Dashboard requires careful planning and consideration. Here are the steps to follow:
1. Define your project goals and KPIs: Start by clearly defining your project goals and the key performance indicators (KPIs) that will help you measure progress towards those goals. Identify the metrics that are most relevant to your project, such as sprint velocity, burndown rate, and customer satisfaction.
2. Choose the right tool or software: Select a tool or software that aligns with your project requirements and team’s preferences. There are various options available, including Jira and Trello. Consider factors such as ease of use, scalability, and integration capabilities when making your decision.
3. Configure your dashboard: Once you have chosen a tool, configure your Agile Reporting Dashboard according to your project’s needs. Customize the visualizations, add the relevant metrics, and establish data connections to ensure real-time updates.
4. Share the dashboard with stakeholders: Ensure that all relevant stakeholders have access to the Agile Reporting Dashboard. This promotes transparency and collaboration, allowing everyone to stay informed and contribute to the project’s success. Consider setting up automated reports or notifications to keep stakeholders updated on project progress.
What is a sprint dashboard?
A Sprint Dashboard is a specific type of Agile Reporting Dashboard that focuses on tracking and monitoring the progress of individual sprints. It provides real-time insights into the sprint’s goals, backlog items, and team performance. A sprint dashboard typically includes visualizations such as burndown charts, sprint velocity, and task completion rates. It helps Scrum teams stay on track, identify potential issues, and take corrective actions during the sprint.
Tools and software for creating an agile reporting dashboard
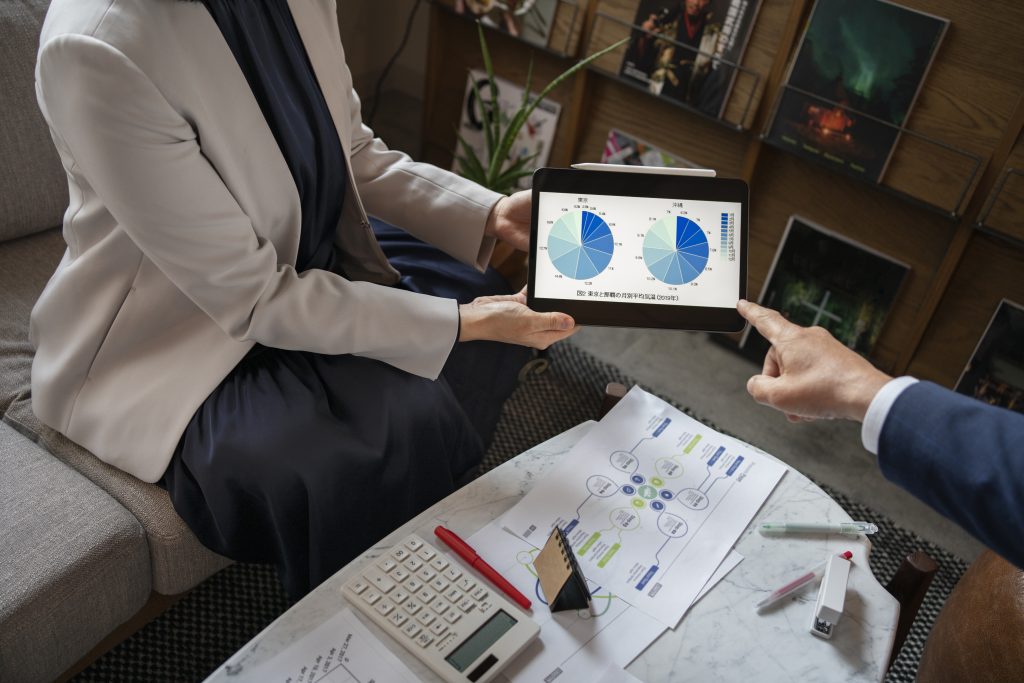
There are several tools and software available to create an Agile Reporting Dashboard. Some popular options include:
1. Jira: Jira is a comprehensive project management tool that offers robust reporting capabilities. It allows teams to customize their dashboards, visualize Agile metrics, and generate detailed reports.
2. Trello: Trello is a simple yet powerful project management tool that offers basic reporting features. It provides a Kanban-style board for visualizing tasks and progress, making it ideal for small to medium-sized Agile teams.
Each tool has its own strengths and features, so it’s essential to evaluate your project’s requirements and team’s preferences before making a decision.
Agile reporting dashboard vs traditional reporting methods
Agile Reporting Dashboards offer several advantages over traditional reporting methods. Unlike traditional reports that are often static and time-consuming to create, Agile dashboards provide real-time insights into project performance. They allow for better visibility, collaboration, and decision-making, enabling teams to respond quickly to changes and deliver high-quality results.
Agile Reporting Dashboards also promote transparency and accountability, as they provide stakeholders with a centralized source of truth for project data. They eliminate the need for manual data collection, analysis, and reporting, saving valuable time and effort.
Agile reporting dashboard example
To illustrate the power of an Agile Reporting Dashboard, let’s consider an example of a software development project. The Agile Reporting Dashboard for this project includes visualizations such as:
- The Sprint Burndown Chart illustrates the sprint’s progress by monitoring remaining work over time. This visualization aids the team in understanding their progress and adjusting plans as needed.
- Moving on to the Task Status Tracker, this tool provides a comprehensive overview of task status, highlighting whether tasks are in progress, completed, or blocked. It equips the team with the insights needed to identify bottlenecks and take essential actions to maintain project momentum.
- Transitioning to the Velocity Chart, this visual representation showcases the team’s historical performance in terms of completed story points over time. Not only does it provide valuable insights into past achievements, but it also enables the team to forecast the volume of work they can undertake in upcoming sprints.
By having access to these visualizations in real-time, the project team can make data-driven decisions, identify potential risks, and ensure timely delivery of the software.
Conclusion: Embracing the power of agile reporting dashboards
In conclusion, an Agile Reporting Dashboard is a valuable tool for teams and organizations practicing Agile methodology. It provides improved visibility, enhances decision-making, and increases productivity and efficiency. By setting up an Agile Reporting Dashboard and following best practices, teams can unlock the full potential of Agile project management and drive successful outcomes.
Embrace the power of Agile Reporting Dashboards and experience the benefits they bring to your projects. Start by defining your project goals, choosing the right tools, and customizing your dashboard to meet your specific needs. With an Agile Reporting Dashboard in place, you can track your project’s progress, identify areas of improvement, and make informed decisions to deliver high-quality results.
Invest in an Agile Reporting Dashboard today and take your project management to new heights!
Learn about the best Agile practices for your team and your project management process. Read our article about Agile Development Velocity
IT METRICS TO BECOME AN EXPERT





Leave a Reply